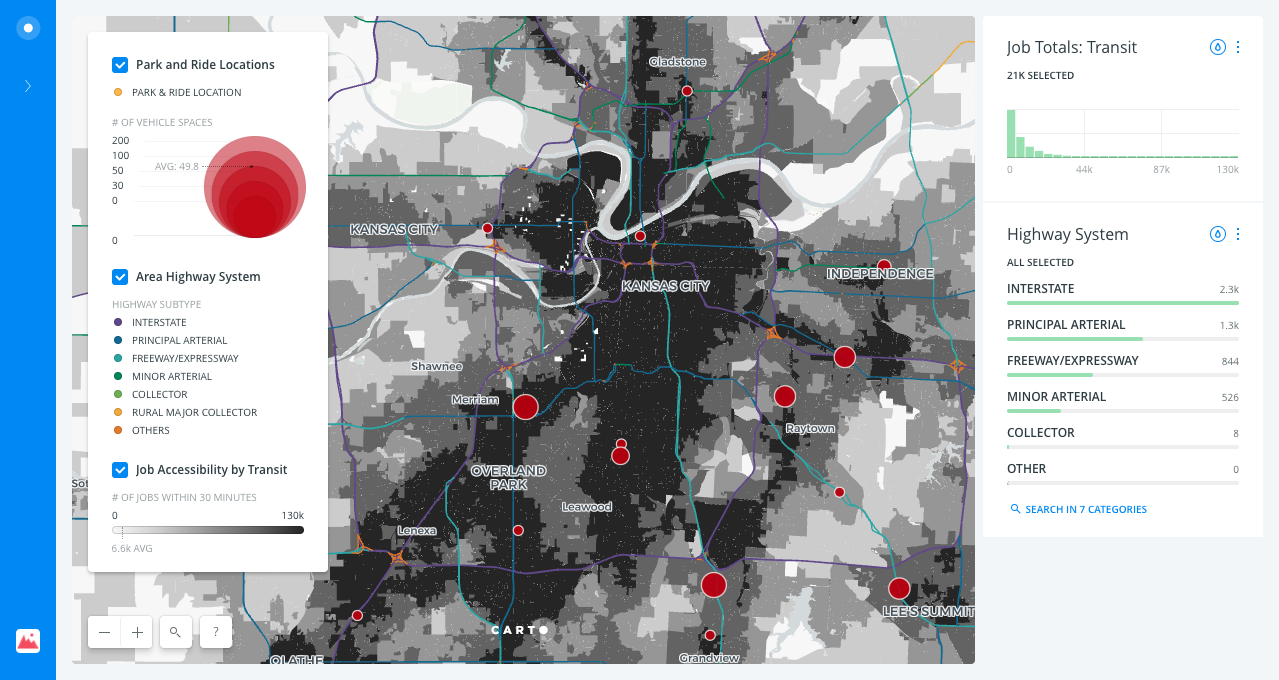
This analysis displays a heat map of the number of jobs that can be reached by public transit within an estimated 30-minute travel time in the Kansas City metropolitan area. Areas with darker a darker background have a greater number of jobs accessible by public transit job. The map has added overlays of Kansas City's highway infrastructure and the locations of public Park & Ride" locations (scaled in the map by the number of parking spaces provided). Unsurprisingly, areas along interstates (purple lines) and major arterials (dark blue lines) are hotspots for transit accessible jobs, and also contain the largest Park & Ride locations.
Kamille combined several data sets to determine the neighborhoods with the highest percentage of jobs that can be reached by public transit. From this data, Ms. Parks generated an online interactive map that allows users to filter results by transit line, availability of Park & Ride spots, and estimated travel time. The dynamic map automatically adjusts to inputs set by the user to illustrate the differences between scenarios in real time.

